How to read live roulette statistics: hot numbers, cold numbers and streaks
A practical guide to the numbers on every tracker: what hot, cold and streak figures mean, and how to read them well.
Every roulette tracker shows hot numbers, cold numbers and streaks. Read well, they tell you exactly what is going on at a table — and which tables are doing something unusual right now. Here is how to read each one.
Hot numbers
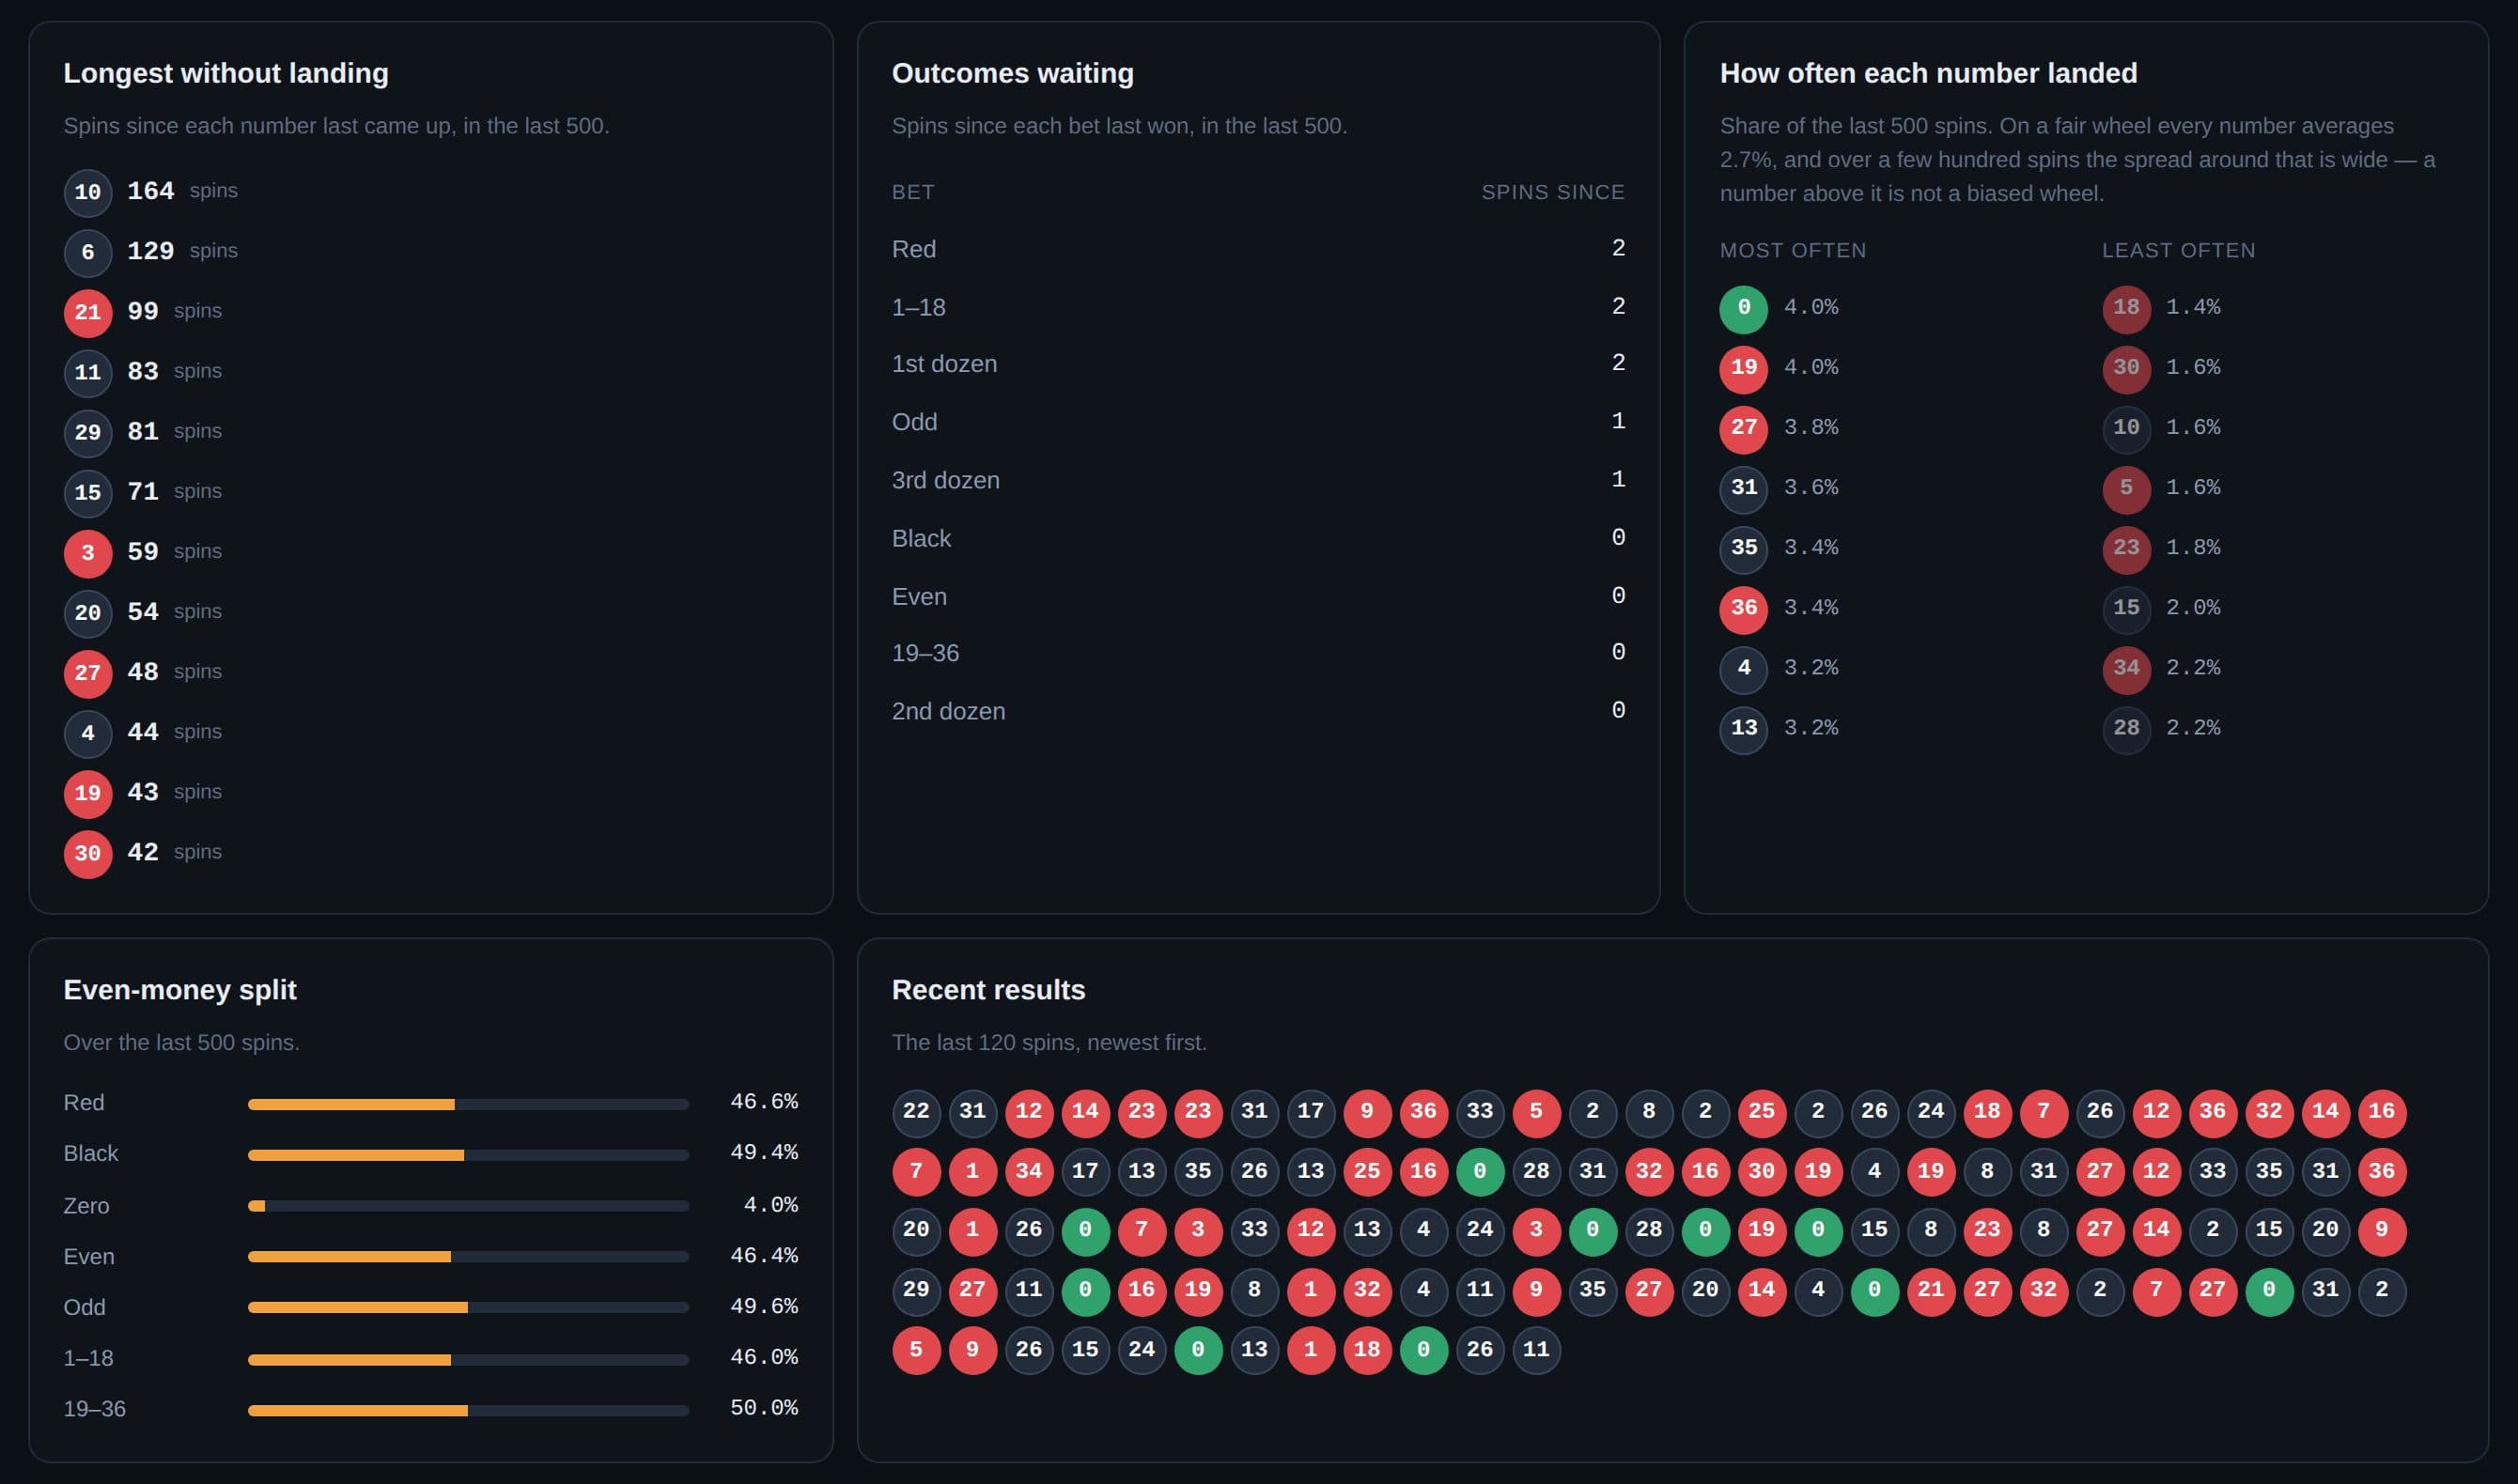
A hot number is one that has landed more often than the rest in some recent window. On a fair wheel every number averages 2.7% of spins, but over a few hundred spins the spread around that is wide, and someone always has to be top.
Binomial(500, 1/37) — the wheel's own maths
So a number showing 4% in a 500-spin window is still inside the normal range. The useful habit: always read a hot number next to its window. That is why every figure on our game pages states how many spins it covers.
Cold numbers
A cold number has not landed in a while. To know whether “a while” is long, you need yardsticks. From 2,466,574 gaps we measured:
- 26spins — typical gap
- 84spins — 1-in-10 gap
- 168spins — 1-in-100 gap
- 597spins — longest recorded
A number 40 spins cold is ordinary. Past 168 you are looking at one of the rarest gaps there is. More on this in how often a roulette number repeats.
Streaks on even-money bets
Red eight times running feels like a pattern revealing itself. Here is how common it really is: in 28 days across 137 live tables, red or black went missing for 8+ spins 22,768 times — around 6 times a day on a single table. Ten in a row happened 5,540 times.
Common enough to see often, uncommon enough to notice. The streaks that are genuinely rare are much longer, and they are spread across many tables — which is what a roulette streak tracker is for.
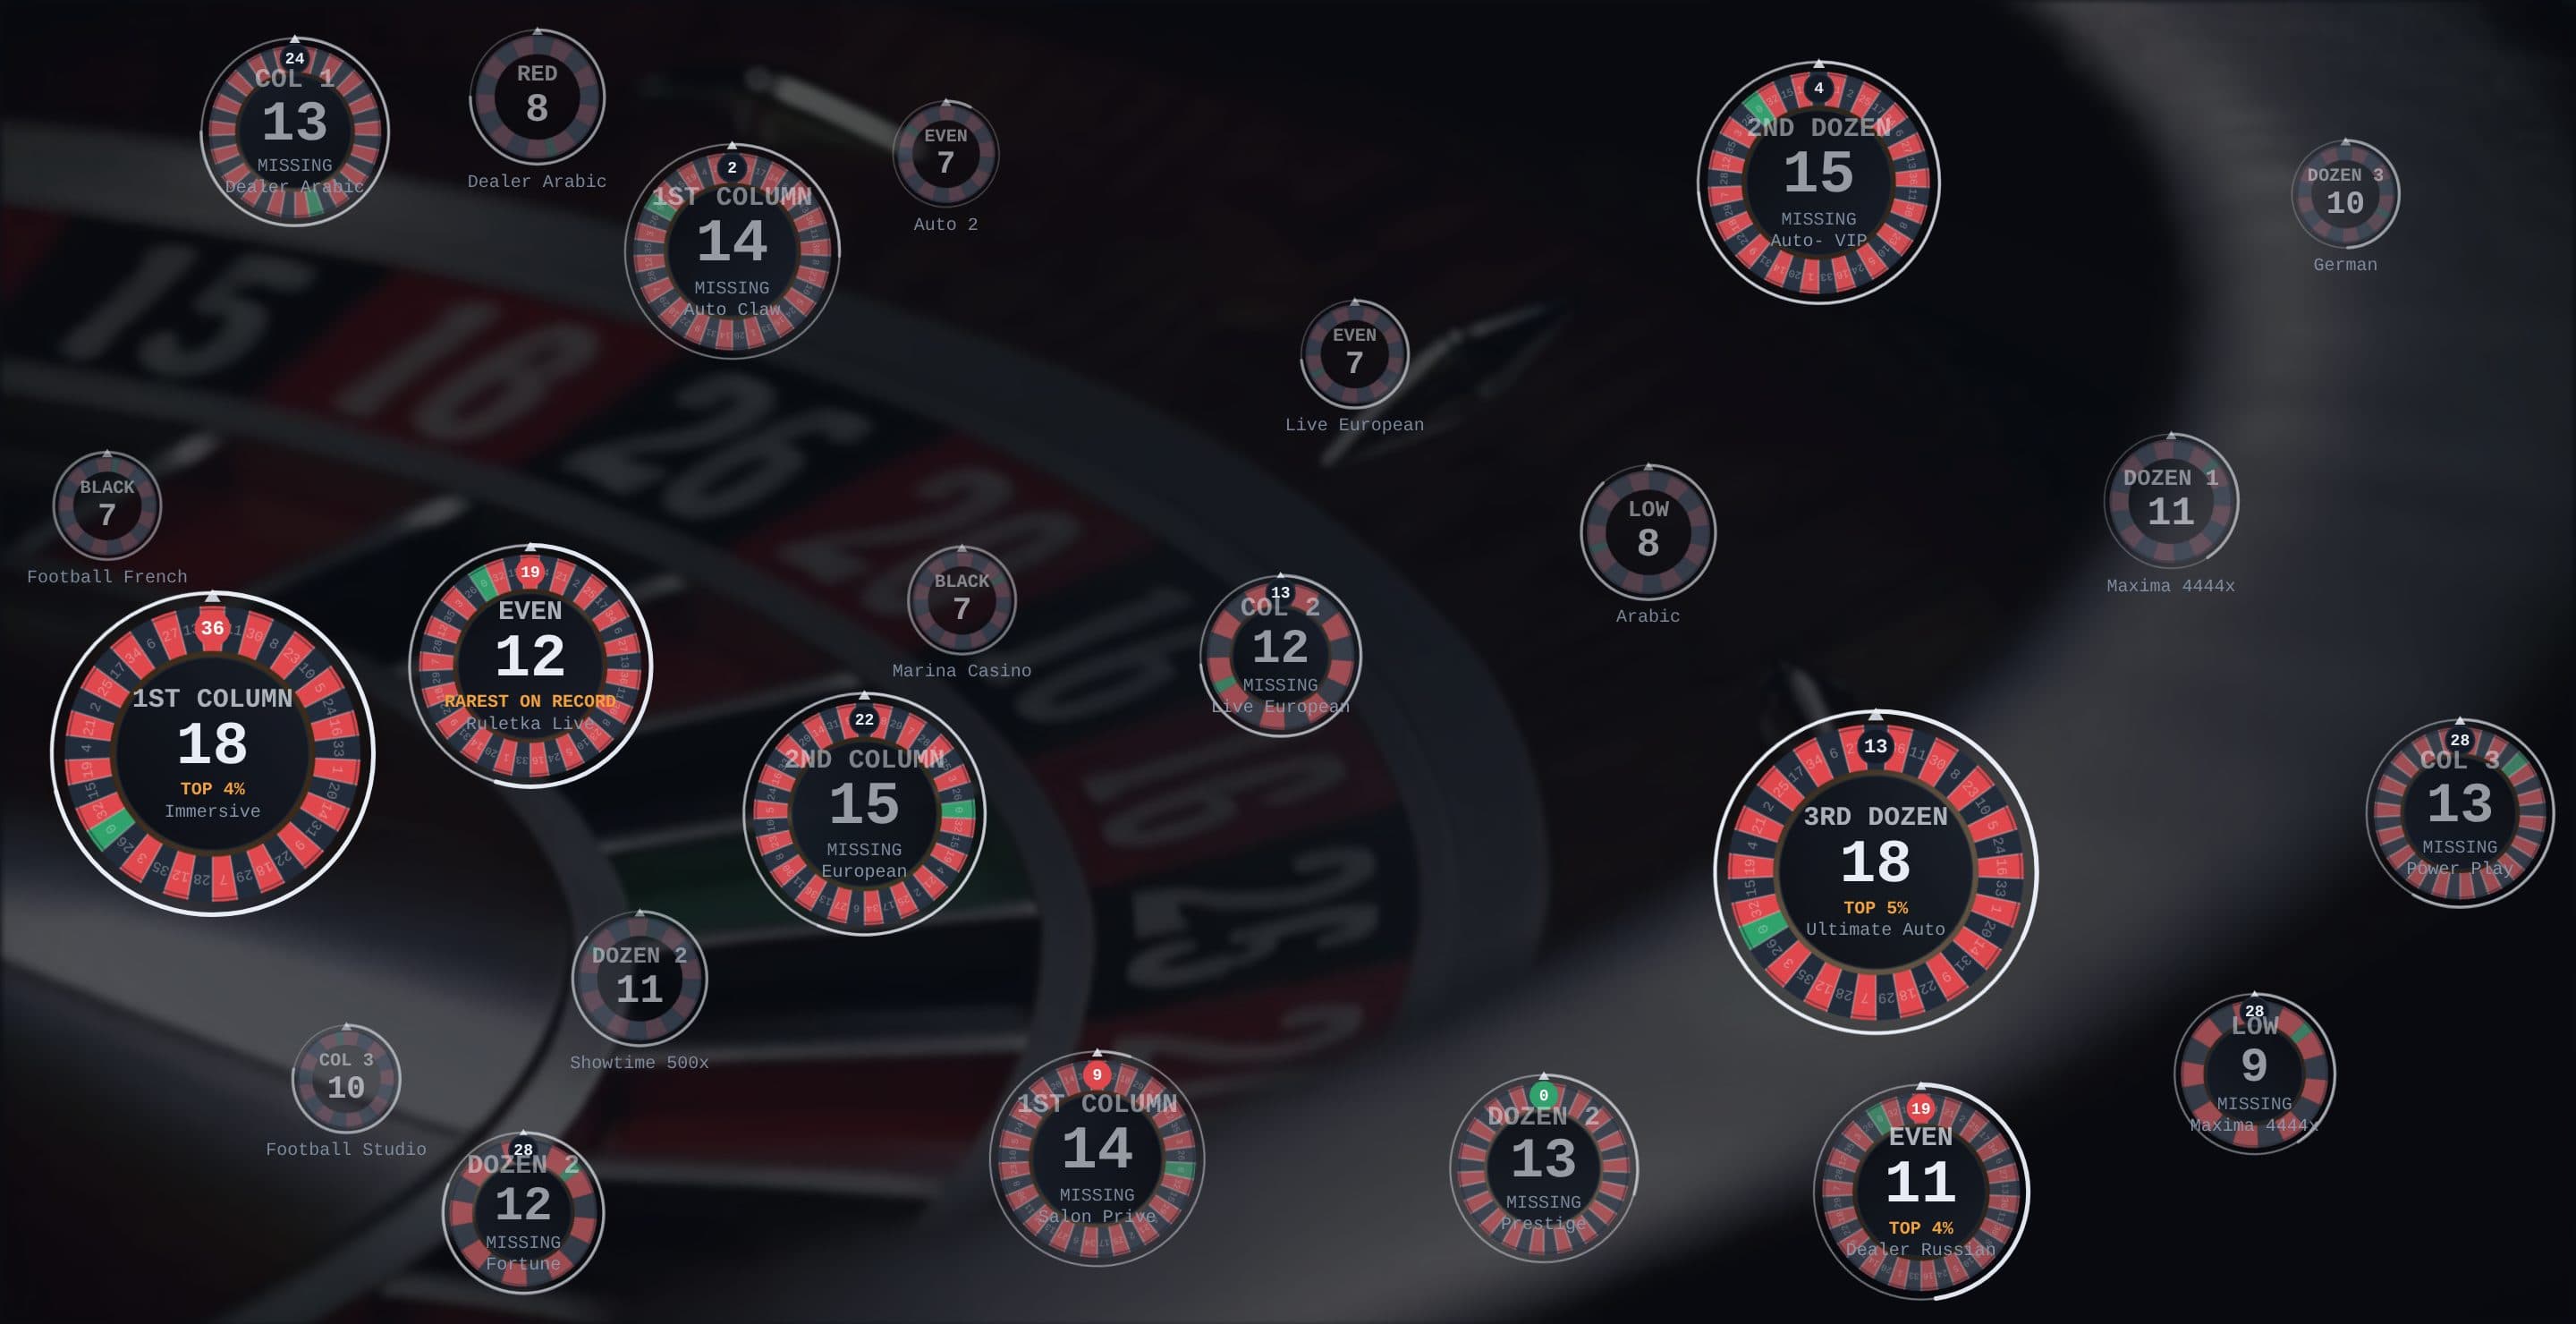
Hot and cold numbers update with every spin on each table's page. Pick a table
Crash multipliers
Crash games have no pockets — a round pays a continuous multiplier — so they are read differently. What matters is the spread: 51.4% of 65,769 recorded rounds paid under 2×, and the median was 1.94×. The figure to watch is the cold run: see how long crash cold runs last.
How to use statistics well
- Check the window. A percentage without a sample size cannot be read.
- Use yardsticks. Compare a gap or streak with the typical, 1-in-10 and 1-in-100 lengths.
- Look across tables. Rare events are rare per table; across 159 tables they happen all day.
- Check the spins behind a figure. A good tracker shows every result a number is built from.
Done that way, statistics give you real context in real time: what is ordinary, what is genuinely unusual, and where it is happening.
Questions players ask
What are hot and cold numbers in roulette?
A hot number has landed more often than average in a recent window of spins; a cold number has not landed for a while. On a single-zero wheel each number averages 2.7% of spins over the long run, so both are measured against that.
How many spins should roulette statistics cover?
The more the better, and always check the window. Over 500 spins a fair number lands anywhere from about 7 to 20 times (1.4% to 4%) in 95% of cases, so a short window makes ordinary numbers look hot or cold.
How often does red or black go missing for 8 spins?
Often. In 28 days across 137 live tables, red or black went missing for 8 or more spins 22,768 times — around 6 times a day on an average table.
Where can I see live roulette statistics?
GameData365 shows live statistics for 159 roulette tables: hot and cold numbers, outcomes waiting, recent results, and a live board of every streak running right now.